Parallelism Problems within SQL Server
The Dangers of Defaults
Some of the defaults in earlier versions of SQL Server are less than ideal, particularly Cost Threshold For Parallelism (CTFP) and Max Degree Of Parallelism (MAXDOP)
Sure, things have improved in later versions. For example, since SQL Server 2019 the installer now prompts you to change MAXDOP.
However, its still a problem for many workloads, I see this issue regularly across multiple client environments.
One of the most common settings I see left at the defaults are CTFP and MAXDOP .
Environments like these often suffer from:
- Too many (unecessary) worker threads spinning up with each query
- Uneven worker thread distribution
- Expensive (unnecessary) disk spills
- Excessive waiting on a single core when one thread carries most of the workload
Leaving cost threshold for parallelism and maxdop at their defaults is asking for trouble - and I am going to show why.
Unused Worker Threads Example
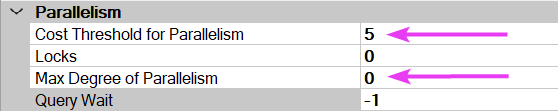
For this example, I have set my CTFP and MAXDOP to the defaults (on anything pre SQL 2019):
For this demo, we are using the larger Stack Overflow database. Below is our simple query:
SELECT b.Id, b.UserId
FROM dbo.Badges b
WHERE b.Name = N'Proofreader'
Here is the execution plan it generates:
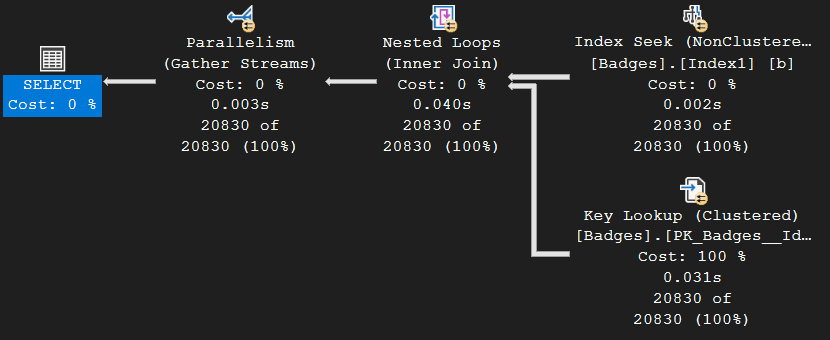
As you can see, we have a parallel icon on every operator, which indicates this query went parallel across multiple worker threads. That’s good, right? Well, not quite…
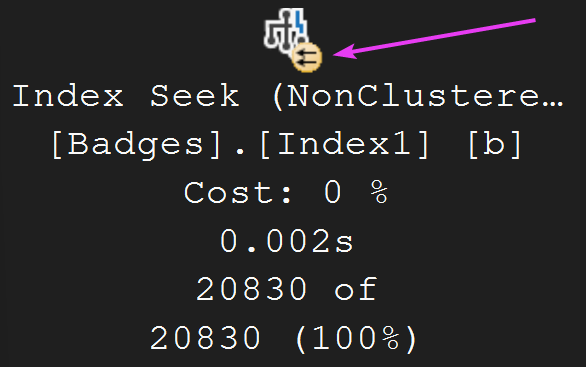
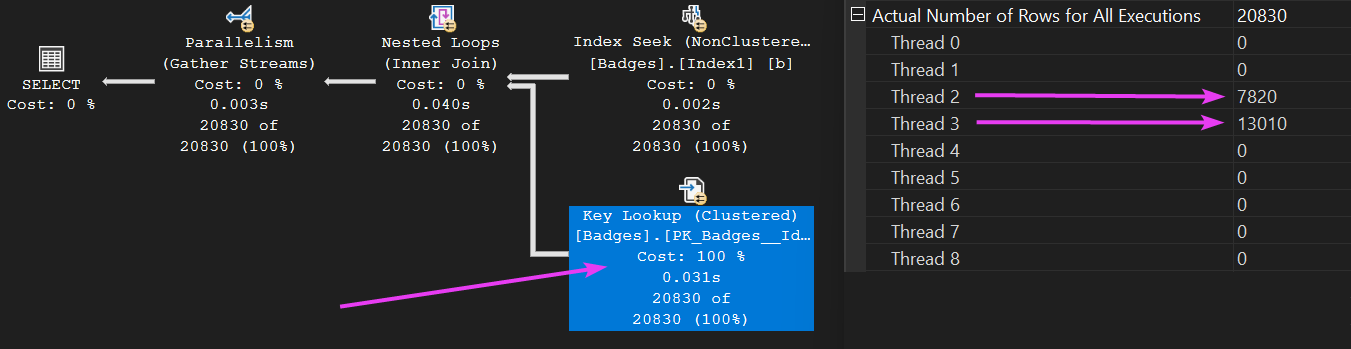
Let’s examine how the work was distributed across those threads for one of the operators:
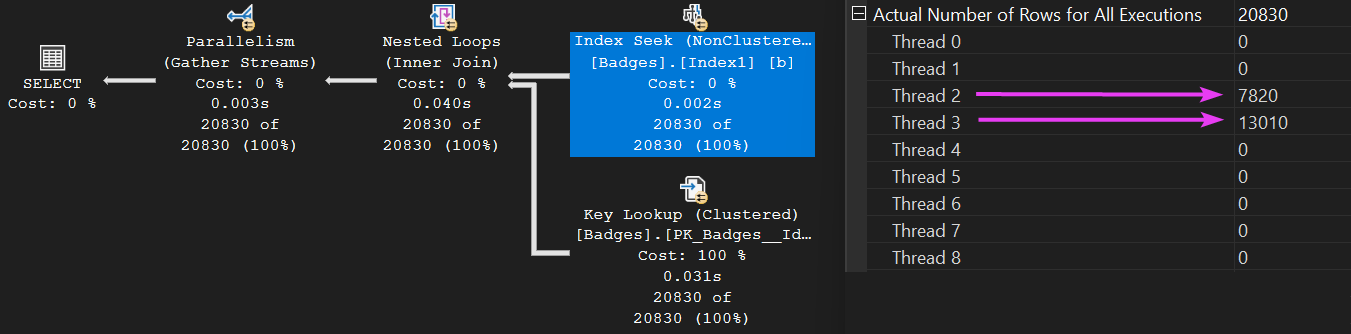
We spun up eight worker threads for this query (meaning it ran in parallel). However, the workload distribution wasn’t exactly balanced. Only threads two and three actually did any work. Sad trombone 🎺
The Problem with Uneven Worker Threads
As we’ve seen, just because a query goes “parallel” across multiple threads, doesn’t guarantee that work goes across those threads evenly. Some of those threads may end up with zero tasks to do, whilst a couple of the threads have all the work to do.
In our execution plan, when this parallelism operator:
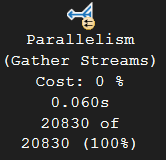
appears on the far left, it means that all operators to its right have executed in parallel. This is indicated by the arrows on each operator:
go faster stripes
In our execution plan, all the operators apparently went ‘parallel’:

However, in this case, this also means that each of those operators also had unevenly distributed worker thread allocation. For each of the operators, we see the same imbalance in workload distribution:
The Key Lookup operator exhibits the same skewed worker thread distribution as the other operators. However, once the process reaches the Parallelism operator, the workload is reorganised.
Now, let’s add an ORDER BY to our query, as I want to get an operator in our execution which gets a memory grant:
SELECT b.Id, b.UserId
FROM dbo.Badges b
WHERE b.Name = N'Proofreader'
ORDER BY b.UserId ASC
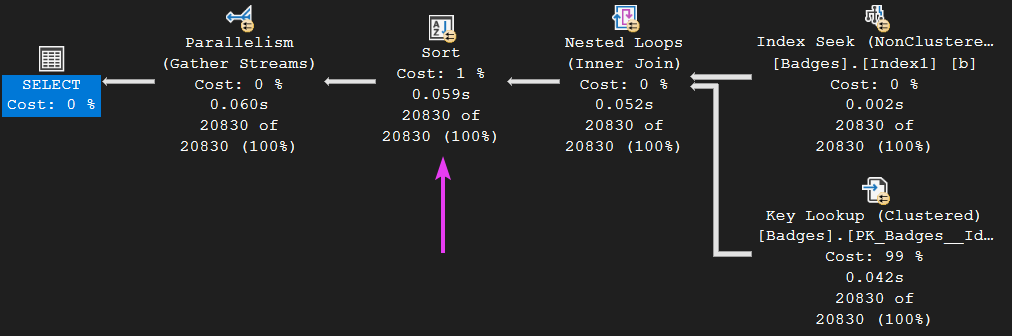
This generates the following execution plan, now with a sort operator:
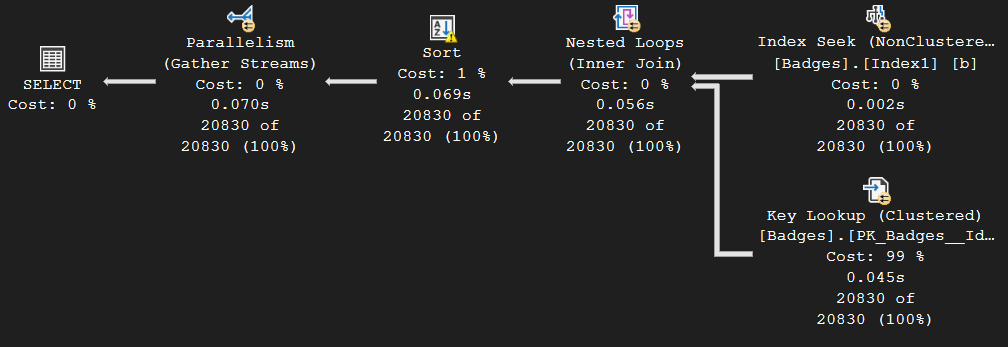
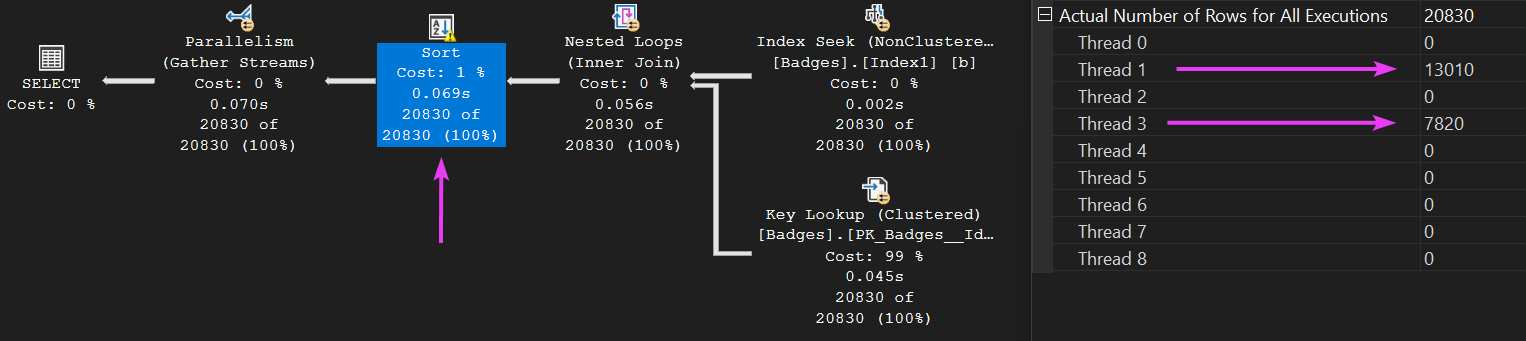
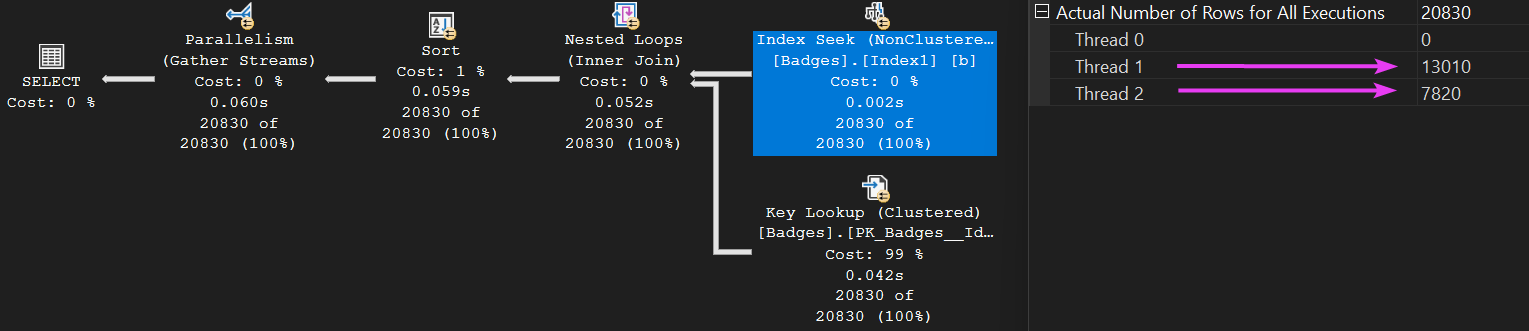
Once again, our query went parallel. Looking at how the work was distributed, we can see it was uneven with only two of the worker threads doing any work:
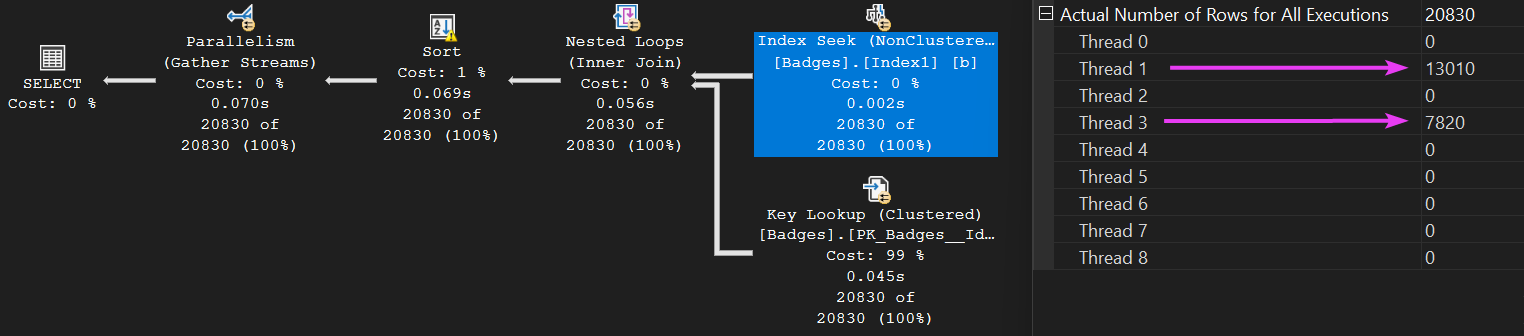
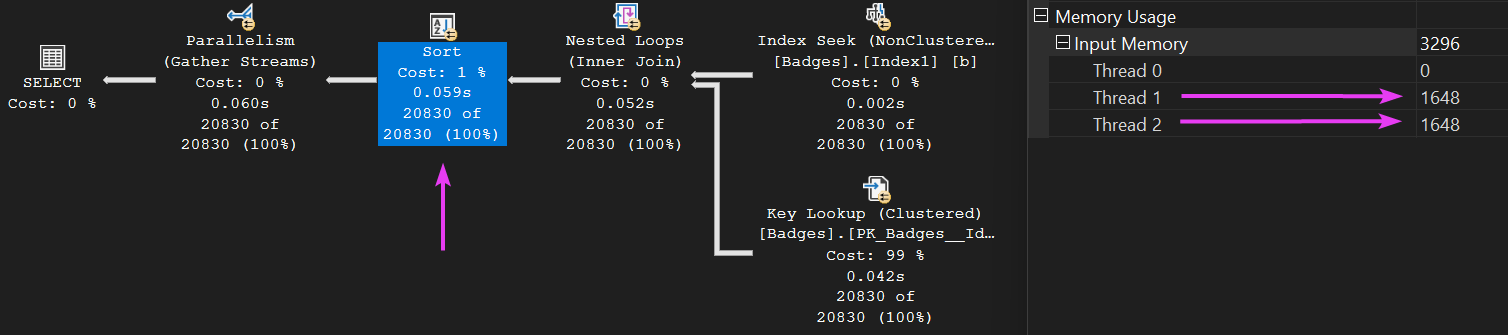
Clicking on the Sort operator, we can see the same two threads did all the work here too:
Now, let us look at the memory details of this sort operator:
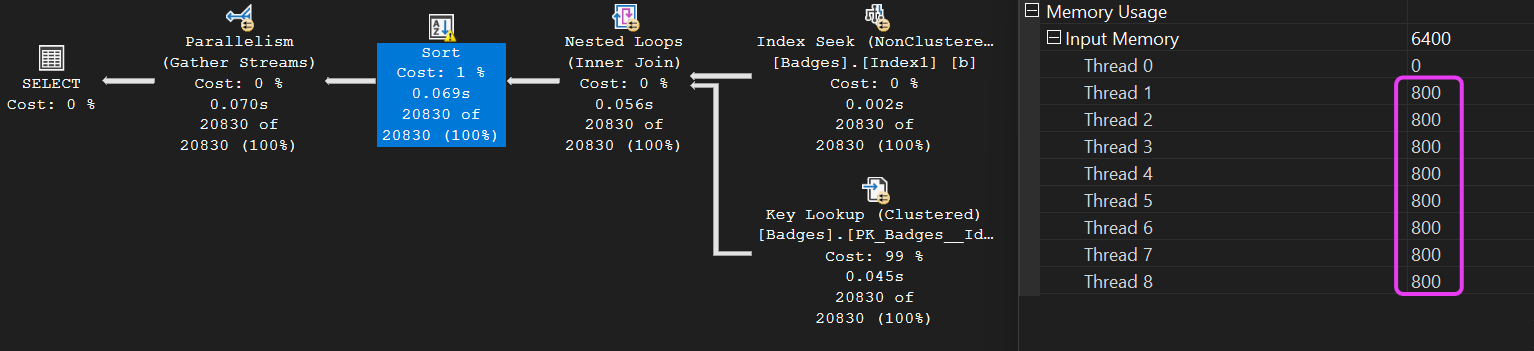
Well, would you look at that, even though we know the only threads that actually had any work to do in this plan were threads 1 and 3, the memory grant was STILL distributed evenly across all 8 threads.
Let’s re-iterate this point, because it’s important.
When SQL decided how to execute our query, it gave the query an overall Memory Grant of 7168KB, We can see this if we hover over the SELECT operator within the plan:
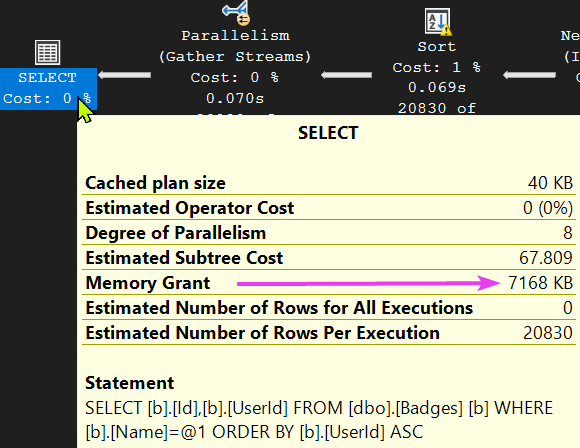
That Memory Grant was used by the SORT operator, and an amount memory was distributed ’evenly’ across the eight worker threads even though the only threads that needed it were threads 1 and 3.
The memory for the other six threads was simply not used for anything even though - and importantly - it was still allocated to this query.
In fact, this concept explains why we spilled to disk on the sort operator (indicated by the yellow exclamation mark on the operator):
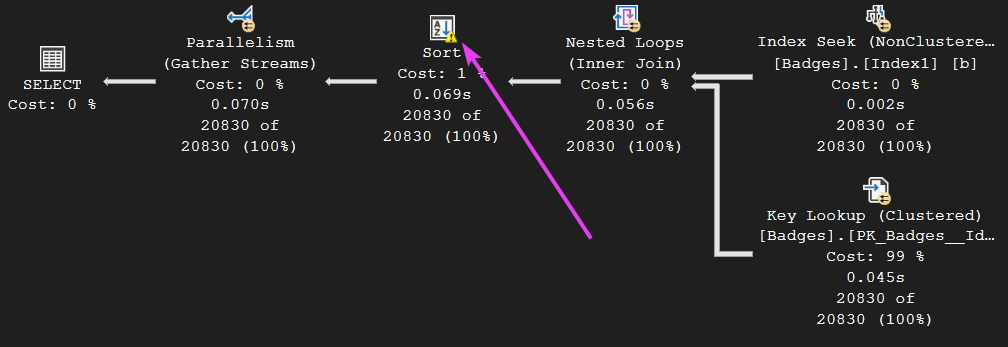
We spilled to disk because, even though the query got an adequate memory grant overall (the 7168KB), Worker threads one and three only received a small chunk of that memory grant (800 each). The rest of the memory grant was used up by the other six threads that had zero work assigned to them. Because of this, the query had to spill to disk, as there simply wasn’t enough memory available for the two worker threads doing the work.
We could technically stop the spill to disk, by limiting the amount of worker threads in use. Let’s add a MAXDOP hint to our query:
SELECT b.Id, b.UserId
FROM dbo.Badges b
WHERE b.Name = N'Proofreader'
ORDER BY b.UserId ASC
OPTION (MAXDOP 2)
In the query above, we have specified a MAXDOP of 2, which will limit the query so that it only goes parallel over two cores. Of course, this is a terrible idea in theory, and I wouldn’t recommend it for production workloads unless it made sense to.
Now, let’s look at the execution plan once more. We can see that the spill has not occurred this time on the SORT operator:
Looking at one of the other operators, we can see that we only used two worker threads:
Side note: Thread 0 is the coordinating thread, so it does not behave the same way as other threads. Think of it as the ‘manager’ of the other threads, distributing and organising the work.
If we review the memory allocation by thread on the SORT operator, we can see that the two threads this time received all of the memory allocation for this operator, which is exactly why it does not spill to disk:
But does this help us? No, not really. We have successfully stopped the spill to disk, but what happens when the query runs and the working dataset differs drastically in size? We might actually want to go parallel across eight cores for that example.
Key Takeaways
Today we looked at one of the many reasons SQL Server defaults should be changed. Things have improved in later versions of SQL where the installer prompts you to amend some of these settings. However, on versions prior to this, it’s such a common problem.
I see many client environments where the settings for MAXDOP and CTFP are still at their defaults and queries are going wild in regards to going parallel.
Everyone has their own takes on what these should be set to initially and it will normally vary depending on all the factors involved such as server size and workload size. But the main takeaway is to not leave them at CTFP = 5 and MAXDOP = 0
As a general rule of thumb, I would always choose to update the two mentioned settings to something more sensible, such as:
- CTFP: 30 to 50 (as a starting point)
- MAXDOP: Official recommendations
Thanks for reading!
If you’ve found this post helpful or would just like to support the work I do here, consider buying me a coffee.