Learning SQL Server 2025: Optimized sp_executesql
Introduction
I have finally started looking deeper into some of the new features of SQL Server 2025 and this post will cover the first of many planned posts around all that is new and shiny within SQL 2025.
I just love it when there are new features to dive into and explore. For me, reading, interpreting and blogging is a great cycle of activity to use when learning new things. I mean, we all know the time you really get to learn about features is when you get to use them for real, against production workloads. But for now, let’s get to it.
What Is It?
OPTIMIZED_SP_EXECUTESQL is a new performance related feature within SQL 2025. It’s a database level configuration which is, by default off and requires the user to explicitly enable it before you can utilise it.
With OPTIMIZED_SP_EXECUTESQL enabled, SQL Server will change the way in which it processes requests using sp_executesql in a bid to do the following:
- Reduce unnecessary overhead on the SQL instance when identical batch requests are submitted via sp_executesql. This is demonstrated nicely here, in this Data() Exposed video with Derek Wilson and Anna Hoffman.
- Reduce unnecessary plan cache bloat. For more information about what plan cache bloat actually is, check here.
How Can We Enable It?
Enabling the feature is pretty straightforward, however there is a recommendation provided by Microsoft before enabling the actual feature which I should point out here.
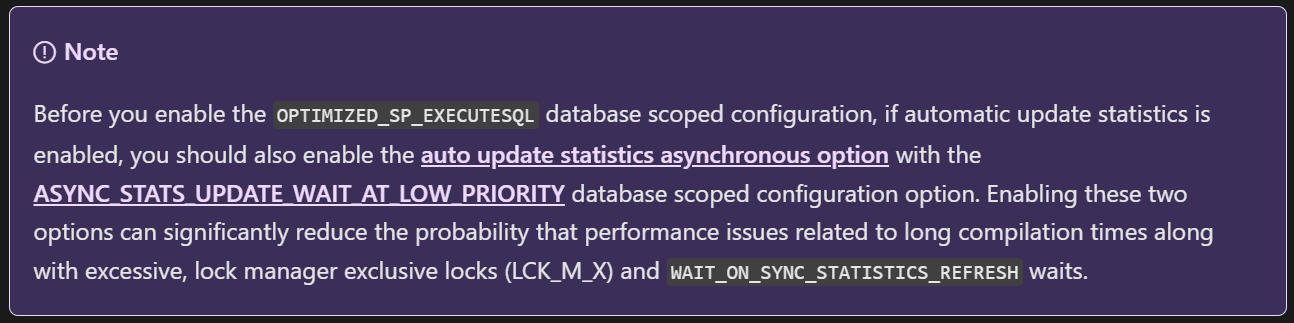
Microsoft recommends that if you wish to use the feature AND you have automatic update statistics enabled then you should ensure that ASYNC_STATS_UPDATE_WAIT_AT_LOW_PRIORITY is also enabled too.
Here is a snippet from the Microsoft Learn page:
So with that said, if you have automatic update statistics enabled, the way to turn on OPTIMIZED_SP_EXECUTESQL would be:
USE StackOverflow;
GO
ALTER DATABASE SCOPED CONFIGURATION SET ASYNC_STATS_UPDATE_WAIT_AT_LOW_PRIORITY = ON;
GO
ALTER DATABASE SCOPED CONFIGURATION SET OPTIMIZED_SP_EXECUTESQL = ON;
GO
Let’s See It In Action
For this small demo, we are going to illustrate the positive impact which this feature can have on the plan cache when thinking about ‘bloat’. We will be using the StackOverflow database and it is in Compatibility Level 170 (SQL 2025).
Step 1 - Ensure the feature is off
In order to show ’normal’ behaviour, we will ensure the feature is off initially:
USE StackOverflow;
GO
ALTER DATABASE SCOPED CONFIGURATION SET ASYNC_STATS_UPDATE_WAIT_AT_LOW_PRIORITY = OFF;
GO
ALTER DATABASE SCOPED CONFIGURATION SET OPTIMIZED_SP_EXECUTESQL = OFF;
GO
Step 2 - Free the Procedure Cache
Let’s free the plan cache to ensure a fair test:
DBCC FREEPROCCACHE
GO
Step 3 - Run a test query using SQLQueryStress
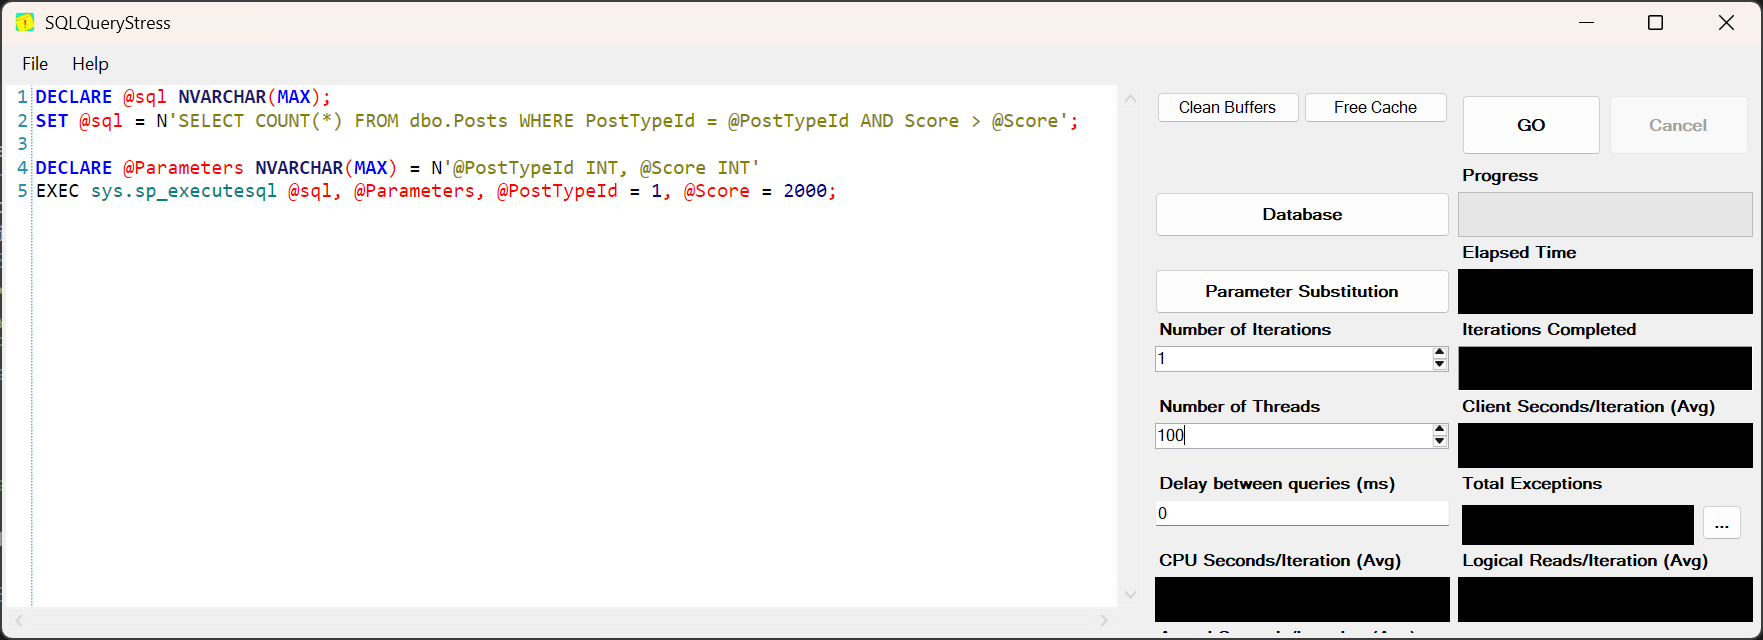
We’re going to utilise the help of SQLQueryStress for this step.
The query we will run using SQLQueryStress is this:
DECLARE @sql NVARCHAR(MAX);
SET @sql = N'SELECT COUNT(*) FROM dbo.Posts WHERE PostTypeId = @PostTypeId AND Score > @Score';

DECLARE @Parameters NVARCHAR(MAX) = N'@PostTypeId INT, @Score INT'
EXEC sys.sp_executesql @sql, @Parameters, @PostTypeId = 1, @Score = 2000;
As shown above, we are using sys.sp_executesql to execute a dynamic string.
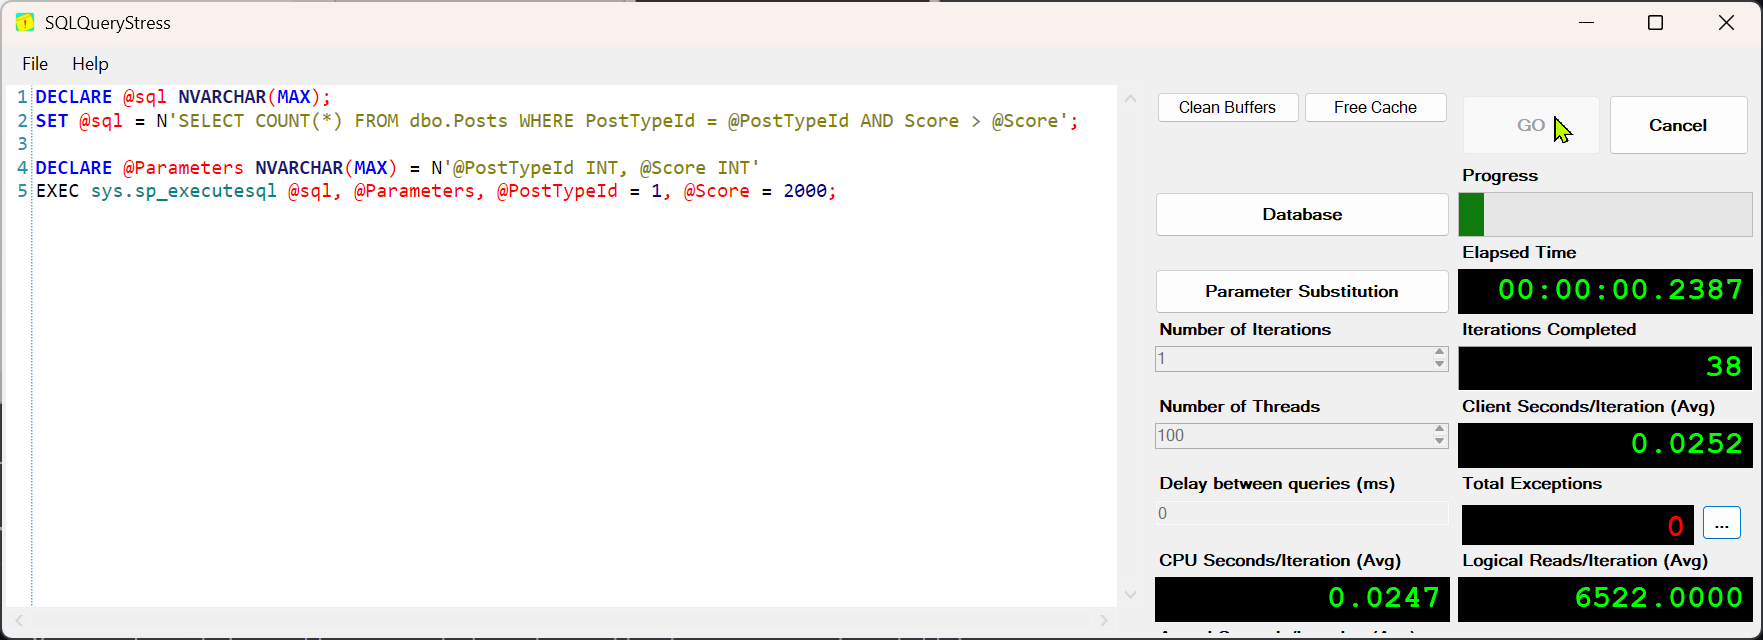
We will run this against our Stack Overflow database, using the following two options specified:
- Number of iterations = 1
- Number of threads = 100 (this is the number of concurrent connections running the query)
Step 4 - Check the plan cache
Now let us check the plan cache, using the following query:
SELECT
    qs.plan_handle,
    qs.sql_handle,
    qs.creation_time,
    qs.execution_count,
    st.text AS sql_text
FROM sys.dm_exec_query_stats AS qs
CROSS APPLY sys.dm_exec_sql_text(qs.sql_handle) AS st
ORDER BY st.text ASC;
We can see that for our single query, we have 23 differing entries within the plan cache:

Above - from the plan cache we have 23 different plan handles, for the same sql_handle (query).
Some may have been executed more than once (totalling 100), however, considering we ran the ‘same’ query, 100 times, it’s not exactly efficient and goes to show one way you can end up with ‘plan cache bloat’.
Step 5 - Enabling the feature
We will now enable the feature, by executing the following:
USE StackOverflow;
GO
ALTER DATABASE SCOPED CONFIGURATION SET ASYNC_STATS_UPDATE_WAIT_AT_LOW_PRIORITY = ON;
GO
ALTER DATABASE SCOPED CONFIGURATION SET OPTIMIZED_SP_EXECUTESQL = ON;
GO
Step 6 - Reset the plan cache
To reset our test, we need to free the plan cache:
DBCC FREEPROCCACHE
GO
Step 7 - Run a test query using SQLQueryStress (again)
Step 8 - Check the plan cache
Now let us check the plan cache, using the following query:
SELECT
    qs.plan_handle,
    qs.sql_handle,
    qs.creation_time,
    qs.execution_count,
    st.text AS sql_text
FROM sys.dm_exec_query_stats AS qs
CROSS APPLY sys.dm_exec_sql_text(qs.sql_handle) AS st
ORDER BY st.text ASC;
This time, the results of the plan cache are quite different. On this run, we only stored one plan within the plan cache, which got used 100 times:

Behind The Scenes
So how does this feature enable this change to happen? How does it go from generating many differing plans for one query, to just one?
Reading the Microsoft Learn page for the feature:

So, ultimately, enabling this feature makes it possible for executions using sp_executesql to behave in the same way a Stored Procedure would.
i.e. the first execution gets cached, other concurrent queries of a similar nature have to wait whilst that initial plan gets compiled.
Now, the pending queries can then just use that one plan once it’s available. Pretty neat huh?
As mentioned earlier in the post, you can see a nice demonstration of this happening in the Data() Exposed video.
Summary
Today we showed one of the ways in which the new SQL 2025 feature OPTIMIZED_SP_EXECUTESQL can help us when tackling the age-old problem of ‘plan cache bloat’.
We took a basic query, executed it dynamically and saw the direct difference it made to the number of entries being stored within the plan cache for that one, identical query.
Of course, we had a small demo, with a small, single query to demonstrate the feature, but just imagine how messy things can (and do) get when you have a seriously busy server, with thousands of dynamically generated queries getting executed per minute.
Memory is arguably one of your most crucial resources when it comes to SQL Server (it’s not up for debate). Do you really want it being used up unnecessarily by holding onto single-use plans, for the same query? No, I wouldn’t either.
Thanks for reading!
If you’ve found this post helpful or would just like to support the work I do here, consider buying me a coffee.