Parameter Sniffing: A Simple Example
Introduction
A while ago, I was working with a client who was experiencing performance issues on SQL Server 2019. We quickly isolated the problematic procedure and they asked ’this normally runs fine, why is this a problem now?’ A fair question.
Digging deeper, I could see we were facing a Parameter Sniffing issue. When I explained this to the client, I found myself looking online to find a good example to help illustrate the concept. This got me thinking that I should probably have something on my own blog to demonstrate how this can happen, so here we are 🙂
Disclaimer: There are many nuances to this topic, and this post is not intended to provide an exhaustive overview. Its purpose is to present a straightforward example to illustrate the concept.
Setting things up
For this demo, we will use the large StackOverflow database (207Gb). We will create ourselves a Stored Procedure called dbo.Rincewind:
CREATE OR ALTER PROCEDURE dbo.Rincewind
    @Badge AS NVARCHAR(40)
AS
BEGIN

SELECT
	b.Name AS [BadgeName],
	b.UserId AS [UserId],
	b.Date AS [DateAwarded]
FROM dbo.Badges b
WHERE b.Name = @Badge

END
GO
The simple Stored Procedure does the following:
- Takes Badge name as an input parameter
- Returns several columns where the badge name matches
Choosing the examples
Now, we’re going to pick two badge names to use when calling the procedure. Looking at the distribution in the dbo.Badges table, some badge names have a large number of records, while others have very few:
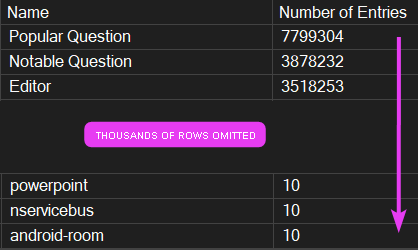
For this demo, we will pick the two badges:
- Popular Question
- powerpoint
I shall explain exactly why shortly.
Executing the Procedure - 1
Now let’s execute our procedure with the first chosen value:
EXEC dbo.Rincewind @Badge = N'Popular Question'
For this run, SQL did 578,098 logical reads:

The plan shows a parallel execution across eight threads, with SQL scanning the clustered index to get the data:
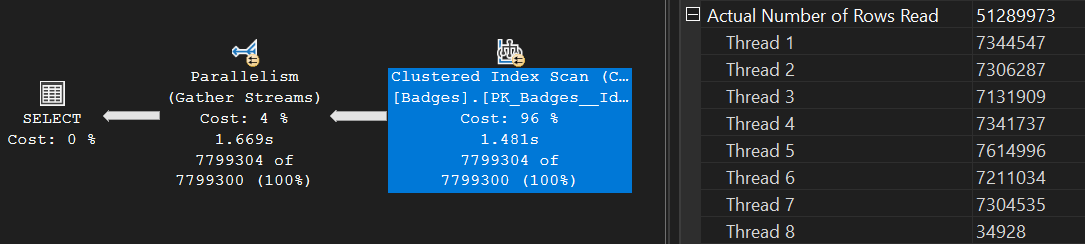
Given the current lack of indexes on this table and the high number of matching records for our badge type - this was a logical choice SQL Server made.
Executing the Procedure - 2
Next, we are going to execute the same procedure, with our other chosen input value of ‘powerpoint’:
EXEC dbo.Rincewind @Badge = N'powerpoint'
For this run, SQL did 583,641 logical reads:

The same plan was used this time too:
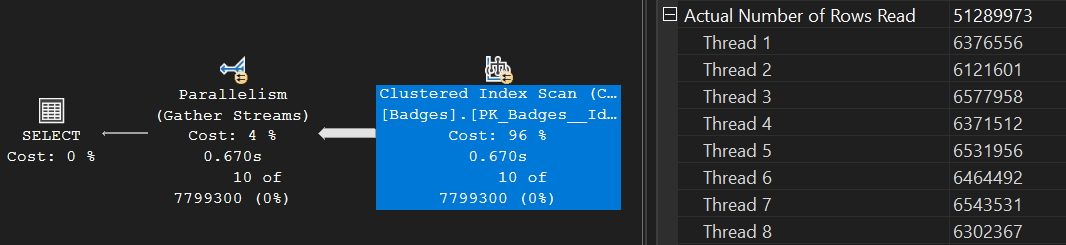
Note: This query went parallel despite the small dataset. While that’s not ideal, it’s not the focus of this post
So far, so good. Both executions finished in a logical amount of time - given the number of records returned - and a logical plan shape was used.
Where things can go wrong
In the previous example, we ran the Stored Procedure twice, with the following options, in the following order:
- Run 1 - a parameter that matches a high number of records
- Run 2 - a parameter that matches a low number of records
But what happens when we run the procedure with the scenarios in the opposite order? Let’s find out…
First, let’s reset things by marking the procedure for recompile. This will remove any cached plans that exist within the procedure cache, for dbo.Rincewind:
EXEC sys.sp_recompile @objname = 'dbo.Rincewind'
Note: In theory, this simulates a server or service restart. Cached plans can (and will) be removed for other reasons, such as memory pressure
Now, let’s run our procedure with the ‘small’ input parameter:
EXEC dbo.Rincewind @Badge = N'powerpoint'
For this run, SQL did 44 logical reads:

The plan chosen looks like this. SQL correctly expected a small result set and chose a non-parallel plan with a lightweight nested loops join:
This time, let’s take note of another point regarding this query’s execution. Looking at the Parameter detail on this plan:
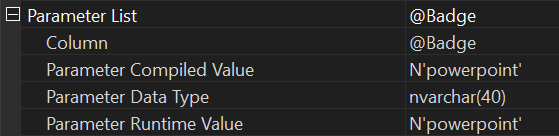
We see that for the Runtime Value used, we have our chosen input of ‘powerpoint’. Additionally, we have the same value for the Compiled Value. All makes sense, right? Jolly good.
Continuing on, we will now run the procedure with the parameter that we know matches a lot more records:
EXEC dbo.Rincewind @Badge = N'Popular Question'
Well, this is odd - the execution this run did a whopping 31,241,807 reads. That’s a 5,303% increase! Additionally, the run-time almost doubled compared to the first time we ran this scenario:

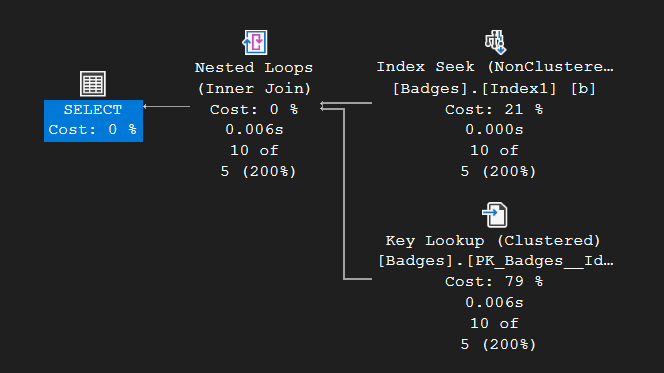
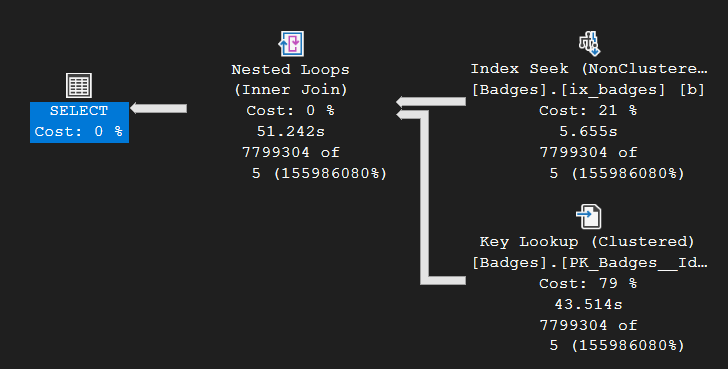
Lets look at the plan chosen:
Showing up to a marathon in flip-flops
Interestingly, the plan again uses a Nested Loops join and did not go parallel. In this case, SQL Server made a poor choice - leading to the sudden slowdown. This type of plan is better suited to smaller datasets, and here’s why:
- The Nested Loops operator is efficient for a small number of rows but performs poorly with larger result sets compared to other join mechanisms.
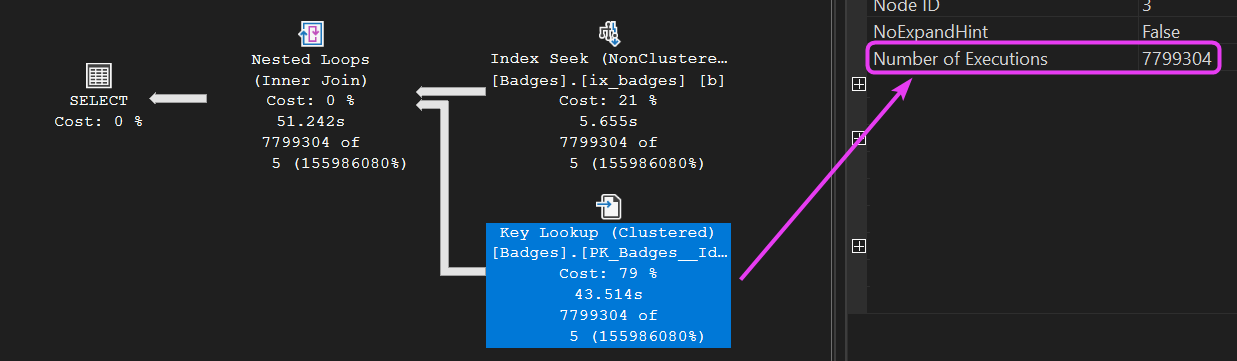
- The Key Lookup had to be executed 7,799,304 times! (see below)
This was exactly the scenario my client faced when performance suddenly tanked. A query that had been running happily for a week or so abruptly ground to a halt, with execution times rising significantly.
So what went wrong?
This issue was caused by a concept known as Parameter Sensitivity.
Our demo illustrated that when we run the procedure in this order, all is well:
- Execute the procedure with an input parameter matching a high number of records
- Execute the procedure with an input parameter matching a low number of records
However, when we ran the procedure in the opposite order - starting with the parameter that matched a small number of records - we encountered a performance issue. Execution time amost doubled and logical reads went sky high.
The issue stems from the execution plan that was previously cached. The first time SQL Server ran the procedure with the ‘small’ parameter, it cached a plan that used a Nested Loops join - ideal for that small dataset. This plan now has the ‘powerpoint’ value embedded in it. From this point on, whenever the procedure is called, SQL Server reuses that cached plan - regardless of the actual parameter value passed in.
When we later ran the same procedure with the ‘large’ parameter, which matches a much higher number of records, performance tanked.
This is because SQL Server reused that same cached plan that was optimised for the earlier, smaller input.
We can actually verify this by checking the Parameter detail on the last plan we generated:
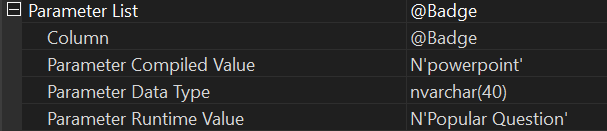
See the difference this time? The compiled value is ‘powerpoint’, while the runtime value is ‘Popular Question’ - indicating that we executed the procedure with the latter.
However, SQL Server reused the cached plan that was optimised for ‘powerpoint’. You and I both know how different those parameters are in terms of the number of matching records. This time, SQL didn’t adjust accordingly and that’s where things went wrong.
This is why I highlighted earlier the difference in record count between these two badge types. When there’s such a disparity, we ideally want SQL Server to use different execution plans tailored to each case or at least make a better-informed choice.
How can we combat this issue?
There are several options available to address this issue, ranging from code changes to considerations around the SQL Server version in use.
Each comes with its own pros and cons, so I’ll be diving deeper into them in a dedicated blog post soon. Keep an eye out for that one.
Thanks for reading!
If you’ve found this post helpful or would just like to support the work I do here, consider buying me a coffee.